Data analysis provides business leaders with insights that help them improve their businesses. This increased understanding of what is happening in their companies leads to better decisions which result in better outcomes for product developers, marketers, and customers. This article will explain why more businesses than ever before rely on data analysis methods and tools to guide their growth.

What Is Data Analysis?
Data analysis is the process through which data is inspected, cleaned, transformed, and modeled in order to provide actionable insights. It’s the process of transforming and interpreting raw data in order to expand the analyst’s knowledge of the subject and help the business improve.
Data drawn from marketing, internal software, or even scraped off the web is subjected to exploratory, quantitative, and secondary methods. For example, in marketing, data analysis is used to predict how consumers will behave in response to a particular type of campaign, then refine the campaign to improve its performance. This helps marketers to ensure that their campaigns fit the interests of consumers in their target audience and drive more sales for the company.
Types of Data Analysis
There are five types of analysis which are used with data. These are:
-
Text
-
Statistical
-
Diagnostic
-
Predictive
-
Prescriptive
Text Analysis
Text analysis is also referred to as data mining. It helps you to find patterns in a large set of data.
Statistical Analysis
Statistical analysis uses data from the past to show you what happened. It involves collecting data so that it can be modeled and inferences can be made from it. While the whole set of data can be used, sometimes a sample is taken for this purpose.
Diagnostic Analysis
Diagnostic analysis shows you why something happened. It usually occurs after statistical analysis has revealed what happened.
Predictive Analysis
Predictive analysis uses past data to make predictions about the future. It’s an estimate, but it can help businesses to understand how customers may respond to anything from a change in price to an adjustment in the type of materials used to manufacture a product.
Prescriptive Analysis
Prescriptive analysis tells you what action to take with the current problem. It takes the insights from all other types of analysis into account.
Why Is Data Analysis Important in 2021?
All businesses operate in an environment where almost every customer is online and uses the internet to shop, learn about new products, or provide feedback on the features that they like or dislike. These customers generate a massive amount of data in the process.
Data is an essential tool for all organizations as a result. Whether you have a small crafts shop that serves your customers in person or a large brand with customers across the globe, data analysis can help you to better understand what customers want to buy, which products they purchase the most at certain times, how to manage your purchasing and inventory, and how to target marketing campaigns to improve your sales.
In 2021, data analysis that’s based on timely data can give you an edge in even the most competitive markets. Even if you’re already the leader in your sector, data analysis can help you keep your edge and find better ways to meet the needs of your clients.
How To Get Started With Data Analysis
First things first, you need to be using a tool or application that lets you gather and organize your data. After that, you can explore the data in order to gain an understanding of a particular aspect of your enterprise.
Before you start to gather data, you’ll have to know why you need it. What do you hope to achieve from your analysis? The sources that you use for gathering data will often differ according to the type of query you have in mind.
Your questions should always be measurable and clear. This will help you to avoid gathering more data than you actually require. It will also speed up the process of analysis.
Be careful in deciding what data you’ll examine and how you choose to assess it. Selecting the wrong data to analyze can skew your results. If you start by analyzing the wrong set of data, you’ll have an inaccurate picture of what’s happening in your business.
Data Analysis Tools
Data analysis tools help businesspeople to process data and use it in different ways to meet their needs. These tools help you to find existing correlations between sets of data and identify patterns in your data. For example, you may realize that every Thursday, the volume of sales peaks at a particular store.
Some of the best data analysis tools include:
-
ETL tools such as Xplenty
-
Python
-
Excel
-
Analytics
-
Evolved
Xplenty
Xplenty is a cloud-based ETL tool that’s used to provide visualized data pipelines. Xplenty allows data flows to be automated across numerous sources and destinations.
This ETL solution lets you clean and normalize your data while complying with best practices for your sector. It’s code-free and you can pull data from all sources that have a Rest API.
You can send your data directly to Salesforce via Xplenty or choose a data warehouse or database as a destination. This ETL tool is focused on security, utilizing masking and field-level encryption to ensure that you’ll always meet compliance standards.
Python
Python is a programming language that’s gained international acclaim. Its versatility is part of the reason why Python is so successful.
Python offers unique features and tools to help meet the needs of your organization. This object-oriented programming language offers a stunning ecosystem. It also has data-oriented features that speed up data processing, saving your team valuable time.
Large data sets can be streamlined by using Python. Since Python is very reliable, engineers can type less code to accomplish every task. In addition, lots of open-source libraries are available for different applications.
Python is easy to learn and with its readability and concise syntax, it’s instantly recognizable. It’s extremely flexible, so you can build data models and use data mining to accomplish your goals quickly. Python is scalable and can solve problems in different industries, prompting many organizations to migrate to it
Excel
Excel has been one of the most important data analysis tools for decades, and many analysts rely on it because they feel confident about using it. Excel is used in every sector and it has several features which make it an asset to anyone who wants to analyze data. For example, the Sort function lets you sort multiple columns or a single column in ascending or descending order.
You can use the Filter tool to only display records that contain certain types of data. Charts help you to display facts in a format that’s easy for you to understand or helps you to effectively make your points as you discuss whatever the data has shown you.
Pivot Tables are useful for extracting significance from large sets of detailed data. You can even use What If analysis to explore the scenarios that result from changing the values that are used with different formulas.
Analytics
The Analytics dashboard enables visual analysis. Your team can use it to connect a wide range of data sources, including databases and cloud drives. You can embed your reports to business applications and websites.
Evolved
Evolved offers solutions that can be used out of the box, helping you to save time. Designed for staff at every skill level, this industrial-strength intelligence platform can handle every challenge and works well in every industry.
Through Evolve’s Data Modeler, you can analyze several Key Performance Indicators (KPIs) simultaneously. The Data Modeler platform lets you upload your data, select your query of interest and start modeling and visualizing right away.
Data Analysis Methods
The three main data analysis methods are:
-
Exploratory
-
Qualitative
-
Secondary
Exploratory Data Analysis
Exploratory data analysis is used to summarize the main characteristics of a data set. Data visualization methods are often used with this type of analysis.
This kind of analysis shows you the best way to use data sources to get the answers you want. This analysis also makes it easier to test assumptions and find patterns in your data.
Exploratory data analysis is used to understand what your data can reveal about your organization, beyond formal modeling. It helps you to identify errors and detect connections among the variables.
Qualitative Data Analysis
Qualitative data analysis looks at data that’s not numerical. For example, if you’re analyzing a recording, that would be qualitative analysis. Anything that you would be able to observe or hear can be analyzed qualitatively.
Verbal or behavioral data is categorized so that it can be tabulated and summarized. Stories presented by respondents are reformulated based on the context and the unique experiences of each person.
Secondary Data Analysis
With secondary data analysis, data that’s collected by others is assessed. For example, government census reports are secondary data. While the data is from a fairly reliable source, you didn’t collect it directly.
This method helps the team to save time and resources. It expands the scope of the research and can help to corroborate your findings. Your initial research question would help you to determine what type of secondary data you would like to use.
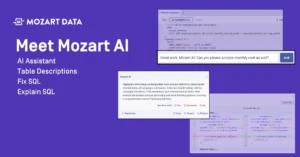
How Mozart Enables Data Analysis
Data analysis isn’t just figuring out what data you have, it’s figuring out what data matters. That means comparing and combining data from different sources to understand what will actually move the needle for your business.
That’s a lot of work under any circumstances, but when your data is spread through different tools, it’s much more difficult. It’s not too difficult to manually combine data from two sources, but something interesting happens when you combine three or more: you find the most interesting outliers, and it becomes nearly impossible to do on your own.
That’s where Mozart can be a game changer. By seamlessly integrating your data into one central home, and making cleaning and transforming data from multiple sources at once, Mozart lets your analysts and data engineers skip all of the grunt work and get right to the good stuff. In fact, your business leaders in marketing, sales, and other departments can access and refresh reports themselves with a few easy lines of SQL, saving your data team time and letting them focus on more important work.
Data analysis doesn’t just become easier when everything’s in one place — it actually gets more powerful because everything new you add reveals new insights about your business.