View the entire data pipeline with our best-in-class visualization
View the entire data pipeline with our best-in-class visualization
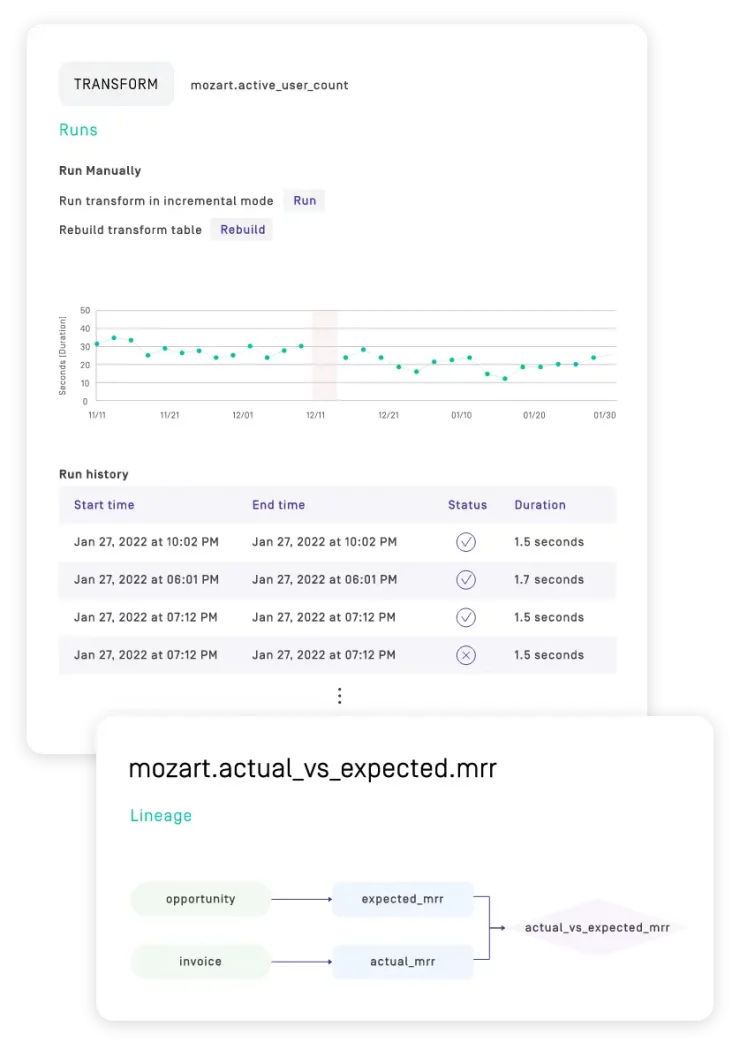
- Observe your entire data pipeline, with clear views of dependencies between tables and transforms
- Troubleshoot faster with indicators of where in the pipeline issues occur
- Save time — our platform infers lineage so you don’t have to waste time manually maintaining it
- Onboard team members faster with a complete view of your data ecosystem

Enable your teams to understand the data pipeline
Data observability can be overwhelming for new team members, especially for experienced data professionals. Our data pipeline tool is clean, intuitive, and easy to understand. You won’t lose any productivity because of complicated platform processes. Scale your team with less effort.
Everything at your fingertips
Being able to see your source tables, the transformations the data goes through, and the resulting tables makes organizing and troubleshooting your pipeline a straightforward process. When you run into an issue, quickly run through your possible breaks: Did a table not sync at the scheduled time? Did something go wrong with the data transformation? Our data pipeline platform gives a comprehensive view of everything, as you can also check the history of the data transformations in your system.
Understand the pipeline and automate
Thanks to the intuitive visual representation of your pipeline, you can make quick decisions on when to sync sources and when to run transformations. Never again waste computing hours running changes with unsynced, outdated, irrelevant data.
Don’t get overwhelmed if you’re using several data sources
With our data pipeline tool, you will know just how often you will need to update your most important source tables, which you may use for several transformations. Conversely, you will also learn how often you should sync infrequently used data from your warehouse.
Frequently asked
questions
A data pipeline is a method of moving data from a specific source to a destination. During the data pipeline process, the data will be optimized and transformed, arriving at its destination in a form that can be analyzed and used quickly.
One option is assigning data engineers the task of piecing together the tools needed to extract data from various siloed sources, load that data into a data warehouse, and transform that data for organization. That data will also need to be made accessible to other tools, such as business intelligence (BI) tools.
The easier option for most organizations is an all-in-one modern data platform, like Mozart Data. All of the tools needed for a data pipeline exist in one spot. This option is faster and cheaper to set up and comes with perks like best-in-class pipeline visualization features that would require separate products if added onto a pipeline by in-house data engineers.
Data lineage shows the data’s life cycle — representing the complete flow from the source to the result. Data lineage helps users understand, record, process, and visualize data from origin to consumption, including all transformations (the way the data was changed) along the way.
Seeing the entire data lineage from the source through transformation to the end tables enables a company to make smarter business decisions and work within and across teams faster and more efficiently while allowing for faster troubleshooting and more effective risk management.
Become a data maestro

Using Sigma with Mozart Data
Overview Hey there – we’re diving into an exciting walkthrough of how to integrate Sigma Computing (“Sigma”), a business

Customer Analytics for Startups
This post was written by guest author Trevor Fox. Every startup of a certain size, at a certain degree of
