This post was written by Mozart Data Co-Founder and CEO, Peter Fishman.
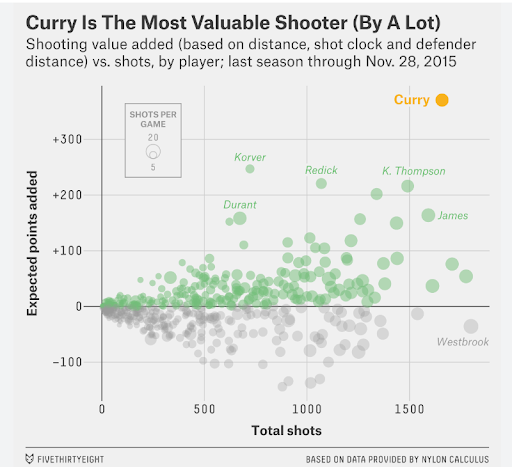
In 2015, I became a season ticket holder of the Golden State Warriors. They had an exciting backcourt duo – Stephen Curry and Klay Thompson. Of course, years later, we know the Splash Brothers as perhaps the greatest shooting backcourt of all time. But here’s a graph you might have come across in 2015 (from Benjamin Morris of FiveThirtyEight)…

The point that the author is making is that Steph is really really good (which is, of course, correct and years later seems even more so).
If I had been an analyst either looking at, creating (or thinking of creating), or critiquing this graph, I would go through some of the following…
First off, I would try to understand the implication, story, trend, or outlier identified – Steph is abnormal and in a very good way.
Second, I would try to understand the business implications of the potential insight. If I run a basketball team, I should potentially hire Steph. If I coach a team, I should potentially give him the ball more or defend him more. There are definitely possible actions and implications (and the word “possible” here is very important – being great doesn’t mean that he would be worth the contract, or if he were given more marginal shots that he would continue to be a positive outlier. But at the very least, there are some potential considerations that would result from a chart that identifies high output shooters.
Third, I would assume that the graph and conclusions are wrong. Maybe the data generating the graph is stale or has a typo, and that Curry’s output was inflated by accident. I would try to verify in separate data that Curry does in fact shoot and score as much as the data states. But a great first step in analysis is to assume there’s some data error. What my old boss Ron Kohavi would call Twyman’s Law – any figure that looks interesting or different is usually wrong.
Fourth, given that I’ve verified that the data seems legitimate, I would question the underlying assumptions of the conclusion. “Expected points added” takes fact data in this case shooting events and scores them according to a model with assumptions about distance, time, and defense. Perhaps the model overstates Curry in a way very specific to Curry.
Fifth, I would start to concoct a story about the mechanism by which Curry is excellent (say, he’s an incredibly accurate shooter). I would look for context clues in the data about other players that are outliers. I might notice that Lebron James also stands out as excellent, and that he and Curry both have 5 letter last names. I’d quickly reject that last name causes excellence because I would be dubious of that mechanism.
Sixth, if I felt good about the conclusion and could tie a causal mechanism, I would reconsider the business implications. What could we do differently as an organization to better ourselves (hire better shooters, play closer defense on this player or type of player)?
Seventh, I would go back to feeling nervous about the conclusion which was not experimentally generated. I can’t create another NBA where we have Steph’s twin, but could we try to run something like an experiment? I would also feel nervous about taking an action, where the observed data implication would persist. Perhaps I’d want Curry to shoot even more shots, but changing the context for the conclusion might mean it would be different.
Eighth, I would try to find an operator with agency to make these decisions to partner with to see what actions could be taken given this information, and ideally take them and measure them.
Last, I would think about what additional reporting would be useful to either bolster or extend the conclusion.
This is a simplified version of some steps I might take as an analyst with a dashboard or graphical analysis that draws a conclusion as simple and obvious as – Stephen Curry is a good basketball player. Imagine now the typical dashboard that has a time series of a key company metric; similar (or greater) rigor should be applied. A robust conclusion that produces a company win is precious. Do not expect magic from the dashboards, see them as a tool to speed up a lengthy process of great skepticism that on a rare occasion produces something very valuable.

